Table of Contents

R Programming Language Introduction
R Programming Language is a language and software environment for statistical computing and graphics. It’s widely used for data analysis and visualization, making it an essential tool for data scientists, statisticians, and researchers. It’s also widely used for machine learning and other advanced data analysis techniques. In this blog, we will explore the history, benefits, features, and conclusion of the R language and how it has become one of the most popular languages in data science.
What is R Programming Language?
R is a programming language and software environment for statistical computing and graphics. It was first developed in the early 1990s by Ross Ihaka and Robert Gentleman at the University of Auckland in New Zealand, and has since grown into one of the most widely used programming languages in the world. R is known for its powerful capabilities in data analysis and visualization, making it an ideal choice for data scientists and researchers.
Features of R Programming Language
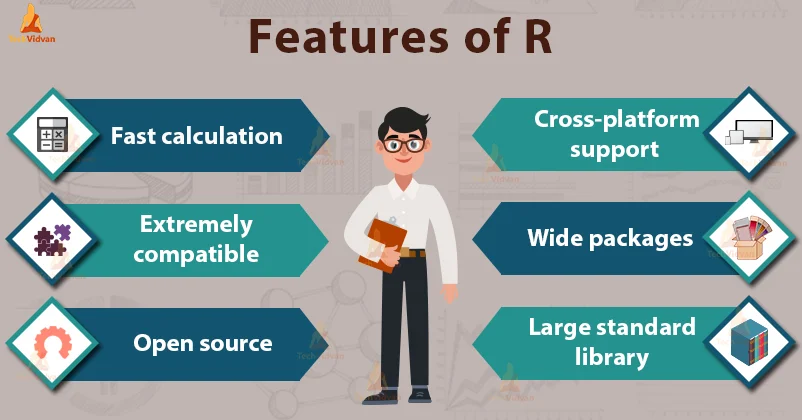
One of the key features of R is its open-source nature, which means that anyone can access and contribute to the codebase. This has led to the development of a large community of users, who have created a wide range of packages and tools that expand the functionality of the language. Some of the most popular packages include dplyr (for data manipulation), ggplot2 (for data visualization), and tidyr (for data cleaning).
R is also known for its powerful data analysis capabilities. The language provides a wide range of statistical functions, including linear and nonlinear modeling, time-series analysis, and hypothesis testing. It also provides a range of tools for data visualization, allowing you to create interactive graphs and charts that can be used to communicate insights and results.
- Statistical Computing: R is a powerful tool for statistical computing, making it a great choice for data scientists and statisticians. It offers a wide range of statistical methods, including regression analysis, hypothesis testing, and statistical modeling.
- Data Visualization: R has a rich set of libraries for data visualization, making it easy to create high-quality graphics and charts to visualize data. Popular libraries include ggplot2, lattice, and plotly.
- Machine Learning: R has extensive support for machine learning, including popular libraries such as caret and randomForest. These libraries allow users to build and train machine learning models, making R a valuable tool for advanced data analysis.
- Big Data Support: R can handle large amounts of data, making it a great choice for big data projects. It has libraries for handling big data, such as dplyr and data.table, which make it easier to work with large datasets.
- Cross-Platform Compatibility: R is compatible with multiple platforms, including Windows, Mac, and Linux, making it a flexible choice for data analysis and visualization.
- Easy to Learn: R is an easy language to learn, especially for those with a background in statistics or mathematics. It has a simple syntax and a wealth of resources for learning and exploring the language.
- Extensive Library of Packages: R has a vast library of packages for data analysis, visualization, and machine learning, which are maintained by a large community of contributors. This makes it easy to extend R’s capabilities and customize it to meet specific needs.
Getting Started with R
Getting started with R is easy, and there are a number of resources available to help you get up and running quickly. The R project provides a free, open-source distribution of the language, which can be downloaded from their website. Additionally, there are a number of online courses and tutorials that can help you learn the basics of R, including Codecademy and Coursera.
Once you have installed R, you can start using it for your own projects. R provides a range of tools for data analysis and visualization, and there are a number of packages available to help you get started. For example, the dplyr package provides a set of functions for data manipulation, and the ggplot2 package provides a powerful framework for data visualization.
R Programming Language Benefits
Benefits of Using R for Data Analysis:
- Open-Source: R is an open-source programming language, which means that it’s free to use and can be easily modified to meet specific needs. This makes it a cost-effective choice for data analysis and visualization, especially for small and medium-sized businesses.
- Comprehensive Data Analysis Tools: R offers a wide range of statistical methods and algorithms for data analysis, including regression analysis, hypothesis testing, and statistical modeling. These tools make it easier to make informed decisions based on data.
- Data Visualization: R has a rich set of libraries for data visualization, making it easy to create high-quality graphics and charts to visualize data. Popular libraries include ggplot2, lattice, and plotly. These libraries help to make data analysis more accessible and visually appealing.
- Machine Learning: R has extensive support for machine learning, including popular libraries such as caret and randomForest. These libraries allow users to build and train machine learning models, making R a valuable tool for advanced data analysis.
- Big Data Support: R can handle large amounts of data, making it a great choice for big data projects. It has libraries for handling big data, such as dplyr and data.table, which make it easier to work with large datasets.
- Cross-Platform Compatibility: R is compatible with multiple platforms, including Windows, Mac, and Linux, making it a flexible choice for data analysis and visualization.
- Active Community: R has a large and active community of contributors, who regularly update and maintain the language and its libraries. This community provides valuable support and resources for R users, making it easier to learn and use the language.
R programming language Tools
R is a widely used programming language for statistical computing and graphics. Its versatility and flexibility make it a popular choice among data scientists, statisticians, and researchers for data analysis. In this blog, we will explore the essential tools for data analysis with R programming language and how they can help make data-driven decisions.
Essential Tools for Data Analysis with R Programming Language:
- ggplot2: ggplot2 is a popular library for data visualization in R. It provides a high-level interface for creating visualizations, such as scatterplots, bar charts, and line charts. ggplot2 is known for its flexibility, allowing users to create customized visualizations with ease.
- dplyr: dplyr is a powerful library for data manipulation in R. It provides a fast and easy way to manipulate large datasets, making it a great choice for big data projects. dplyr offers functions for filtering, grouping, and summarizing data, making it easier to perform data analysis.
- caret: caret is a library for machine learning in R. It provides a unified interface for training and evaluating machine learning models, making it easier to build and compare models. caret supports a wide range of machine learning algorithms, including decision trees, random forests, and support vector machines.
- randomForest: randomForest is a library for building and training random forest models in R. Random forests are a type of machine learning algorithm that can be used for classification and regression problems. randomForest provides a user-friendly interface for building and evaluating random forest models.
- data.table: data.table is a fast and efficient library for handling large datasets in R. It provides an optimized method for manipulating and analyzing large datasets, making it a great choice for big data projects. data.table offers functions for filtering, grouping, and summarizing data, making it easier to perform data analysis.
- lattice: lattice is a library for data visualization in R. It provides a high-level interface for creating visualizations, such as scatterplots, bar charts, and line charts. lattice is known for its ability to create complex visualizations, making it a valuable tool for advanced data analysis.
- plotly: plotly is a library for creating interactive visualizations in R. It provides a high-level interface for creating visualizations, such as scatterplots, bar charts, and line charts. plotly is known for its ability to create interactive visualizations, making it a valuable tool for data exploration and analysis.
Conclusion
R Programming Language has come a long way since its inception, evolving into a versatile and powerful programming language that is widely used in data analysis and statistical computing. With its numerous benefits, including the ability to handle large datasets, perform complex statistical computations, and create visually appealing data visualizations, it is no wonder that R has become a popular choice for data scientists and researchers.
Additionally, its open-source nature has also made it accessible to anyone interested in learning and using it, regardless of their budget. The vast and growing R community, along with its abundant packages and libraries, make it possible for users to find the tools they need to tackle even the most challenging data analysis projects.
Furthermore, the R programming language is not just limited to data analysis, but is also a valuable tool for machine learning and artificial intelligence applications. With its rich set of machine learning algorithms and libraries, R makes it possible to train and deploy complex models, and to make accurate predictions and classifications.
In conclusion, R Programming Language is a powerful, user-friendly, and versatile programming language that offers a multitude of benefits for data analysis, statistical computing, and machine learning. Whether you’re a beginner looking to get started in data science or an experienced data analyst, R is a valuable tool to have in your arsenal. With its growing popularity, the future of R looks bright, and we can expect to see even more exciting advancements and innovations in the world of R programming.