Table of Contents

Introduction
Power Business Intelligence (BI) is a critical aspect of modern-day organizations, as it helps decision-makers make informed choices based on data-driven insights. With the exponential growth of data and the need for real-time analysis, there has been a surge in the demand for effective BI tools. Microsoft’s Power BI is one such tool that has taken the business world by storm and has become one of the most popular BI tools in the market. This article will provide an in-depth look at it and what it has to offer.
What is Power BI?
Power BI is a suite of business analytics tools developed by Microsoft. It offers a cloud-based service for creating and sharing interactive and visually appealing data reports, dashboards, and visualizations. The suite of tools provides an end-to-end solution for data analysis, starting from data retrieval, data transformation, data modeling, and finally, data visualization. The solution can be accessed through a web browser or the BI desktop application, and it integrates with various data sources like Excel spreadsheets, databases, and cloud services like SharePoint and OneDrive.
Features and Benefits of Power BI
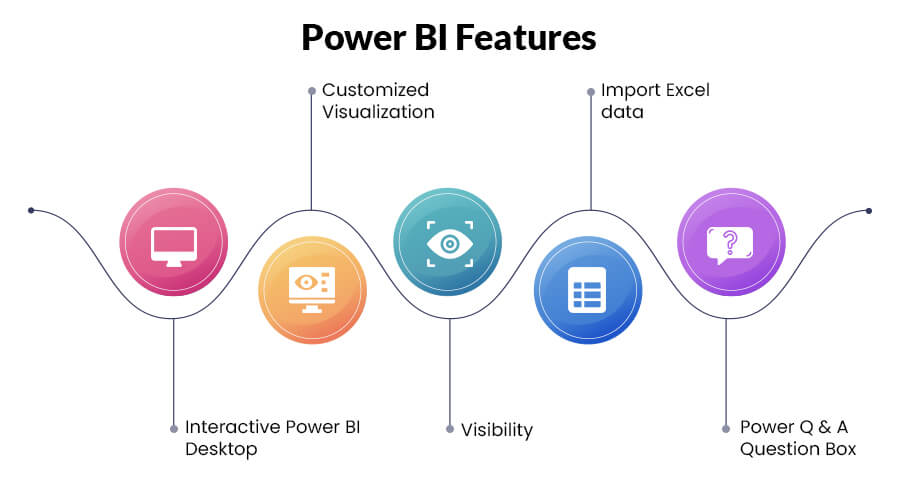
- Intuitive Data Visualization: Power BI provides an array of data visualization options, including bar charts, line charts, pie charts, maps, and more. The visualizations are interactive and can be customized to meet the specific needs of a business. The drag-and-drop interface makes it easy to create data visualizations, even for users with no prior experience.
- Dashboards and Reports: Power BI dashboards provide a single place to view all of your data visualizations and reports. Users can easily access the data they need and make informed decisions based on the data presented. Reports can be saved, shared, and embedded in other applications, making it easy for others to access and use the data.
- Data Integration: Power BI integrates with a wide range of data sources, including Excel spreadsheets, databases, and cloud services like SharePoint and OneDrive. The integration makes it easy to import data and ensure that the data is up-to-date.
- Real-Time Data Analysis: Power BI provides real-time data analysis, enabling users to make informed decisions quickly. The tool’s ability to connect to real-time data sources, like IoT devices, makes it an ideal solution for businesses that require real-time data analysis.
- Collaboration: Power BI allows multiple users to collaborate on a single report, dashboard, or visualization. The collaboration feature makes it easy for team members to work together and share insights, which can lead to better decision-making.
- Mobile Accessibility: Power BI provides mobile access to dashboards and reports, making it easy to access data from anywhere. The mobile app is available for iOS and Android devices and provides a seamless user experience.
How to Use Power BI
Business Intelligence (BI) has become a critical aspect of modern-day organizations, as it helps decision-makers make informed choices based on data-driven insights. Power BI, a suite of business analytics tools developed by Microsoft, has become one of the most popular BI tools in the market. This article provides a step-by-step guide on how to use this effectively to maximize its potential and derive insights from data.
Step 1: Connecting to Data Sources
The first step in using it is connecting to data sources. It integrates with a wide range of data sources, including Excel spreadsheets, databases, and cloud services like SharePoint and OneDrive. Users can connect to their data sources using the BI desktop application or the web-based version. The process of connecting to data sources is straightforward, and BI provides options for scheduling data refreshes and ensuring that the data is always up-to-date.
Step 2: Data Transformation
Once the data has been imported, the next step is to transform the data into a format that can be easily analyzed. BI provides a range of data transformation options, including filtering, grouping, and aggregating data. The drag-and-drop interface makes it easy to perform data transformations, even for users with no prior experience.
Step 3: Creating Visualizations
Power BI provides an array of data visualization options, including bar charts, line charts, pie charts, maps, and more. The visualizations are interactive and can be customized to meet the specific needs of a business. To create a visualization, simply select the data and drag it to the canvas. BI will automatically generate a chart based on the data. Users can then customize the chart to their liking, including changing colors, adding labels, and adjusting the chart type.
Step 4: Creating Dashboards and Reports
Power BI dashboards provide a single place to view all of your data visualizations and reports. To create a dashboard, simply select the visualizations you want to include and add them to a dashboard canvas. Reports can be created in a similar manner, with the added ability to add additional pages and sections. Reports can be saved, shared, and embedded in other applications, making it easy for others to access and use the data.
Step 5: Collaboration
Power BI allows multiple users to collaborate on a single report, dashboard, or visualization. The collaboration feature makes it easy for team members to work together and share insights, which can lead to better decision-making. To collaborate, simply share the report or dashboard with others and add comments or annotations. All changes are saved in real-time, making it easy for team members to stay up-to-date on the latest data and insights.
Step 6: Mobile Accessibility
Power BI provides mobile access to dashboards and reports, making it easy to access data from anywhere. The mobile app is available for iOS and Android devices and provides a seamless user experience. To access BI on a mobile device, simply download the app from the App Store or Google Play and log in with your Microsoft account.
Tools
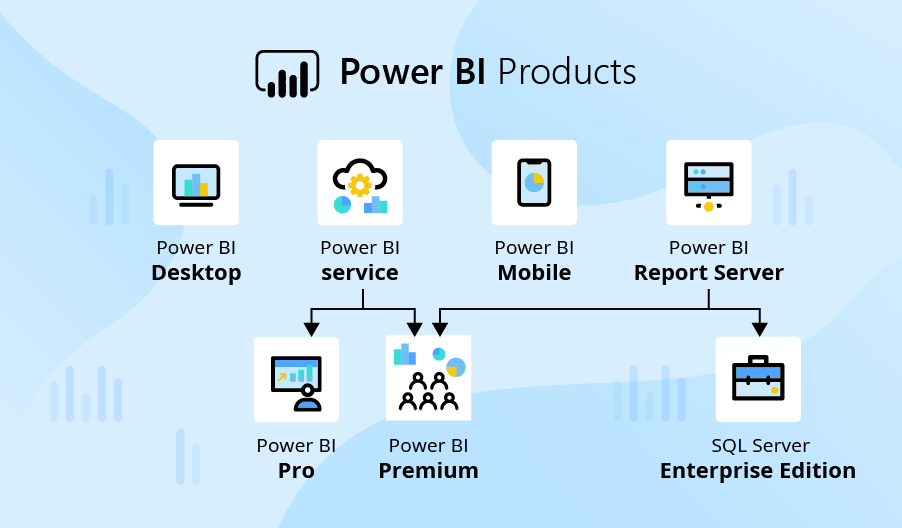
Power BI is a powerful data visualization and business intelligence tool that helps organizations turn data into actionable insights. BI is part of Microsoft’s business intelligence suite and provides an interactive dashboard that enables users to easily analyze data and share insights with others.
In this blog, we’ll explore the various BI tools and how they can help organizations unlock the value of their data. We’ll cover the following topics:
- Power BI Desktop
- Power BI Service
- Power BI Report Server
- Power BI Mobile
- Power BI Embedded
- Power BI Desktop:
- Power BI Desktop
Power BI Desktop is a free Windows application that provides a full-featured environment for creating, analyzing and publishing data. It is designed for data professionals, business analysts and data scientists who need to work with large amounts of data.
The BI Desktop interface provides an intuitive and user-friendly experience, with a powerful data model and data visualization capabilities. It supports a wide range of data sources, including Excel workbooks, cloud-based data, and on-premises data sources such as SQL Server.
One of the key benefits of BI Desktop is the ability to create custom data models. With the ability to create relationships between tables, calculated columns, measures and KPIs, users can create a tailored data model that is specific to their organization. This makes it easier to analyze data, build reports and share insights.
- Power BI Service
Power BI Service is a cloud-based service that provides a web-based interface for exploring and sharing BI reports. It is designed for users who need to access data from anywhere, at any time, and on any device.
The Power BI Service provides a rich set of features for creating and sharing reports, including interactive dashboards, data visualization tools, and mobile-friendly experiences. With the ability to share reports with others, users can collaborate with team members and stakeholders, even when they’re working remotely.
One of the key benefits of BI Service is the ability to work with real-time data. Power BI Service can connect to a wide range of data sources, including streaming data, and automatically refresh reports with the latest data. This makes it easier to stay up-to-date with the latest insights, trends, and business performance.
- Power BI Report Server
Power BI Report Server is a on-premises solution that provides an environment for publishing BI reports. It is designed for organizations that need to host reports locally, or who are unable to use cloud-based solutions due to security or data privacy concerns.
Power BI Report Server provides a similar experience to BI Service, with a web-based interface for exploring and sharing reports. It also provides an environment for managing reports, including report schedules, data sources and user access.
One of the key benefits of BI Report Server is the ability to host reports locally, which can be a key consideration for organizations that need to meet regulatory requirements, or who need to manage data privacy and security concerns.
- Power BI Mobile
Power BI Mobile is a mobile application that provides access to BI reports from a smartphone or tablet. It is designed for users who need to access data on the go, or who are unable to use a computer.
BI Mobile provides a rich set of features for exploring reports, including interactive dashboards, data visualization tools, and the ability to share reports with others. With the ability to access reports from anywhere, at any time, users can stay up-to-date with the latest insights, trends, and business performance.
Conclusion
Power BI is a powerful data visualization and business intelligence tool that helps organizations turn data into actionable insights. With its suite of tools, including Power BI Desktop, Power BI Service, Power BI Report Server, Power BI Mobile, and Power BI Embedded, BI provides a comprehensive solution for exploring, analyzing and sharing data.
One of the key benefits of BI is the ability to connect to a wide range of data sources, including Excel workbooks, cloud-based data, and on-premises data sources such as SQL Server. This makes it easy for organizations to access the data they need to make informed decisions.
Another key benefit of BI is the ability to create custom data models. With the ability to create relationships between tables, calculated columns, measures and KPIs, users can create a tailored data model that is specific to their organization. This makes it easier to analyze data, build reports and share insights.
It also provides a rich set of features for creating and sharing reports, including interactive dashboards, data visualization tools, and mobile-friendly experiences. With the ability to share reports with others, users can collaborate with team members and stakeholders, even when they’re working remotely.
For organizations that need to meet regulatory requirements or manage data privacy and security concerns, Power BI Report Server provides an on-premises solution for publishing reports. And for users who need to access data on the go, Power BI Mobile provides a mobile application that provides access to reports from a smartphone or tablet.
In conclusion, Power BI provides a comprehensive solution for exploring, analyzing and sharing data. With its powerful data visualization and business intelligence capabilities, organizations can turn data into actionable insights, and make informed decisions. Whether you’re a data professional, business analyst or data scientist, It has the tools and features you need to unlock the value of your data.

